

I Predicted the Future With MindsDB
Predicting the download rate of PyPI packages with MindsDB.


One of the amazing features on MindsDB is that you have access to tens of data sources that help you access datasets from other platforms. One of the handlers that I worked on is the PyPI Handler. It uses PyPI's databases as a data source.
In this article, we'll be using this handler to make a prediction over the future download rate of a Python package. Keep in mind that this method uses time-series training strategies and the output is from a linear regression model meaning the output is not quite accurate.
To make this process faster, I'm going to start up a local MindsDB instance and train my model locally. At the end of this tutorial, you'll have access to the Notebook files.
In this tutorial, we need..
A local instance of MindsDB
Jupiter Notebook (optional)
Setting Up
As I said, we need a local MindsDB instance. You can either run up a Docker container or do it in a traditional way using a venv and install the requirements inside the environment.
Follow this official tutorial to run a local MindsDB instance.
Make sure your MindsDB engine is up and running and navigate to http://localhost:47334/. You should see the dashboard.
Train Your Model
Now, we have to train a model before we jump into any further steps. To do so, you have to execute the following SQL code.
CREATE DATABASE pypi_datasource
WITH ENGINE = 'pypi';

CREATE MODEL mindsdb.pypi_model
FROM pypi_datasource
  (SELECT *
FROM pypi_datasource.overall WHERE package="<PACKAGE-NAME>" AND mirrors=true limit 500)
PREDICT downloads;
It creates a PyPI table and prepares a model based on the following SQL sequence.
SELECT *
FROM pypi_datasource.overall WHERE package="<PACKAGE-NAME>" AND mirrors=true limit 500)
PREDICT downloads;
You can refer to this document for more options and parameters if you need to modify your sequence.
I'm trying to predict the download rate of the requests library. It's a famous one so let's see how is our model going to do.

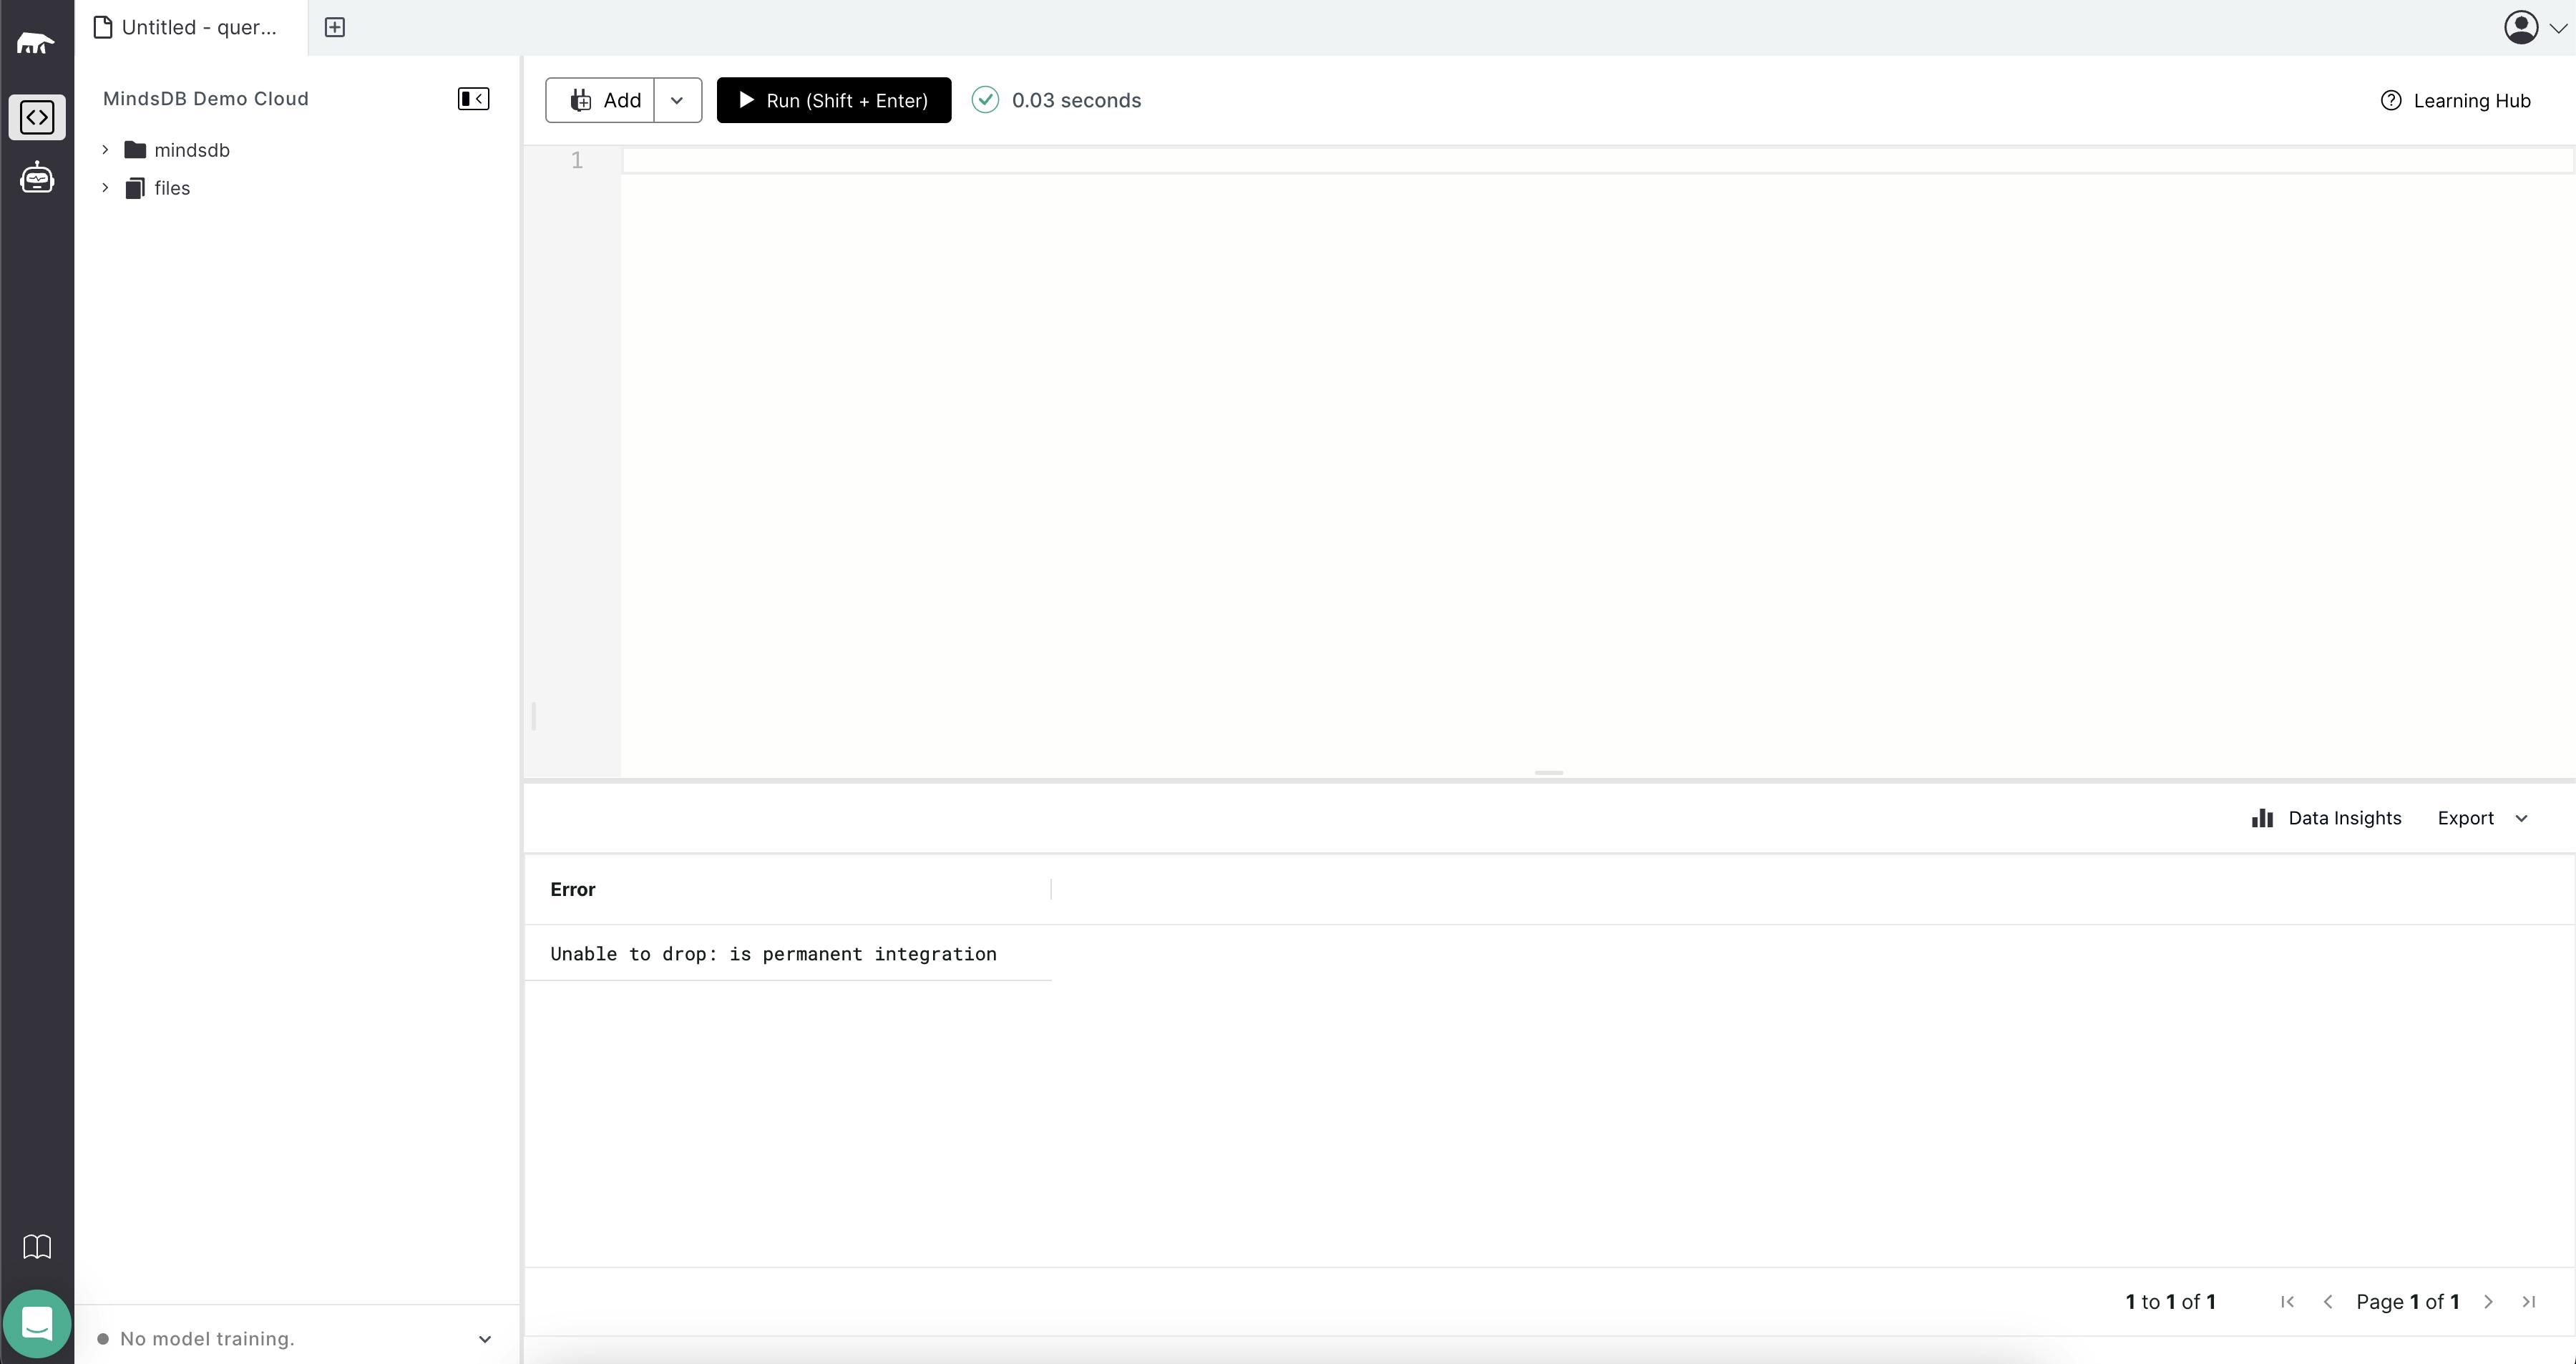
As you can see, my model's status is "generating" meaning my model is not yet ready. Once it's fully prepared and ready to be prompted, you'll see a check mark on the bottom-left part of your dashboard that says your "pypi_model" is ready to be used.
Predict
To do the prediction, I need a bunch of fancy tools to make an epic scene from my prediction. For that manner, I'm using Plotly which is a plotting library in Python. You can use any other tool that you need. To connect to the local MindsDB, I'm using mindsdb_sdk.
Before I jump into the connection phase, I need to set some variables.
# variables
DAYS_TO_BE_PREDICTED = 100
MINDSDB_INSTANCE = "http://127.0.0.1:47334"
PACKAGE_NAME = "requests"
Make sure to modify DAYS_TO_BE_PREDICTED and PACKAGE_NAME variables based on your needs.
from datetime import datetime, timedelta

import mindsdb_sdk

# variables
# ...

server = mindsdb_sdk.connect()
server = mindsdb_sdk.connect(MINDSDB_INSTANCE)

databases = server.list_databases()
database = databases[-1]
Let's take a batch from the download rate data to sort our model for prediction.
query = database.query(
    f'SELECT date, downloads FROM pypi_datasource.overall WHERE package="{PACKAGE_NAME}" AND mirrors=true limit 500'
)
overall_df = query.fetch()
Now, let's take our prediction data based on overall_df.
# an empty dataframe
predicted_df = pd.DataFrame(columns=["date", "downloads"])

today = datetime.today()
current_date = (today - timedelta(days=180)).date()

for i in range(DAYS_TO_BE_PREDICTED):
    query = database.query(
        f'SELECT date, downloads FROM mindsdb.pypi_model WHERE date="{current_date}"'
    )
    predicted_value = query.fetch()
    current_date = (today + timedelta(days=i)).date()
    predicted_df = pd.concat([predicted_df, query.fetch()], ignore_index=True)
Right after the for-loop, our predicted_df is filled with the predicted download rates on each day. This is a quick showcase on how this variable looks like.

As I said, I'll use Plotly to make a plot view from this data and the real values.
import pandas as pd
import plotly.graph_objects as go

# ...

fig = go.Figure()

fig.add_trace(
    go.Scatter(
        x=overall_df["date"], y=overall_df["downloads"], mode="lines", name="Data"
    )
)
fig.add_trace(
    go.Scatter(
        x=predicted_df["date"],
        y=predicted_df["downloads"],
        mode="lines",
        name="Prediction",
    )
)
fig.update_layout(
    title="PyPI Package Download Rate Prediction",
    xaxis_title="Dates",
    yaxis_title="Downloads",
    template="plotly_dark",
)

fig.show()

Hope you've found this implementation helpful.
Useful Links
PyPI Handler: https://github.com/mindsdb/mindsdb/tree/staging/mindsdb/integrations/handlers/pypi_handler/
PyPI Prediction Notebook: https://github.com/lnxpy/pypi-prediction-examples/